
What NAR’s 2026 Forecast Really Says About the Housing Market
Existing Home Sales
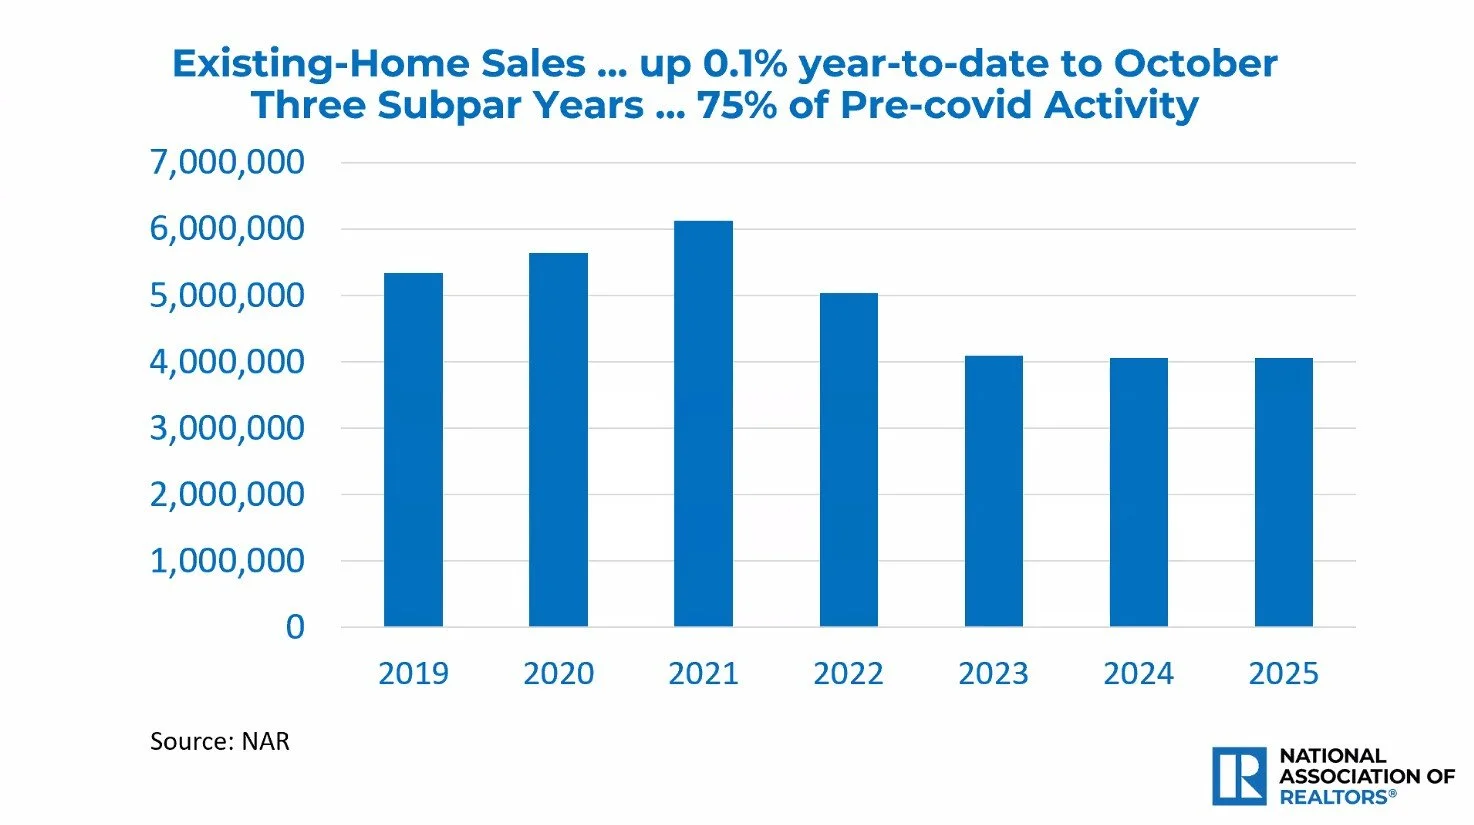
For three straight years, the U.S. housing market has been running at roughly three-quarters of its pre-COVID speed. Existing-home sales peaked around 6 million in 2021 and then fell off a cliff, settling near 4 million annually from 2023 through 2025. That slowdown has been very real: fewer transactions, tighter inventory, frustrated buyers, and sellers sitting on ultra-low mortgage rates.
But if you look closely at the latest National Association of Realtors (NAR) data, the story is more complicated—and more hopeful—than the headlines suggest. The presentation these slides come from is not a tale of collapse. It’s a picture of a market that has been constrained, not destroyed, and a forecast that points to a very different environment in 2026.
Let’s unpack what NAR is actually saying.
First-Time Buyers: Historically Squeezed, Not Disappearing
First-Time Home Buyers Hit All-Time Low
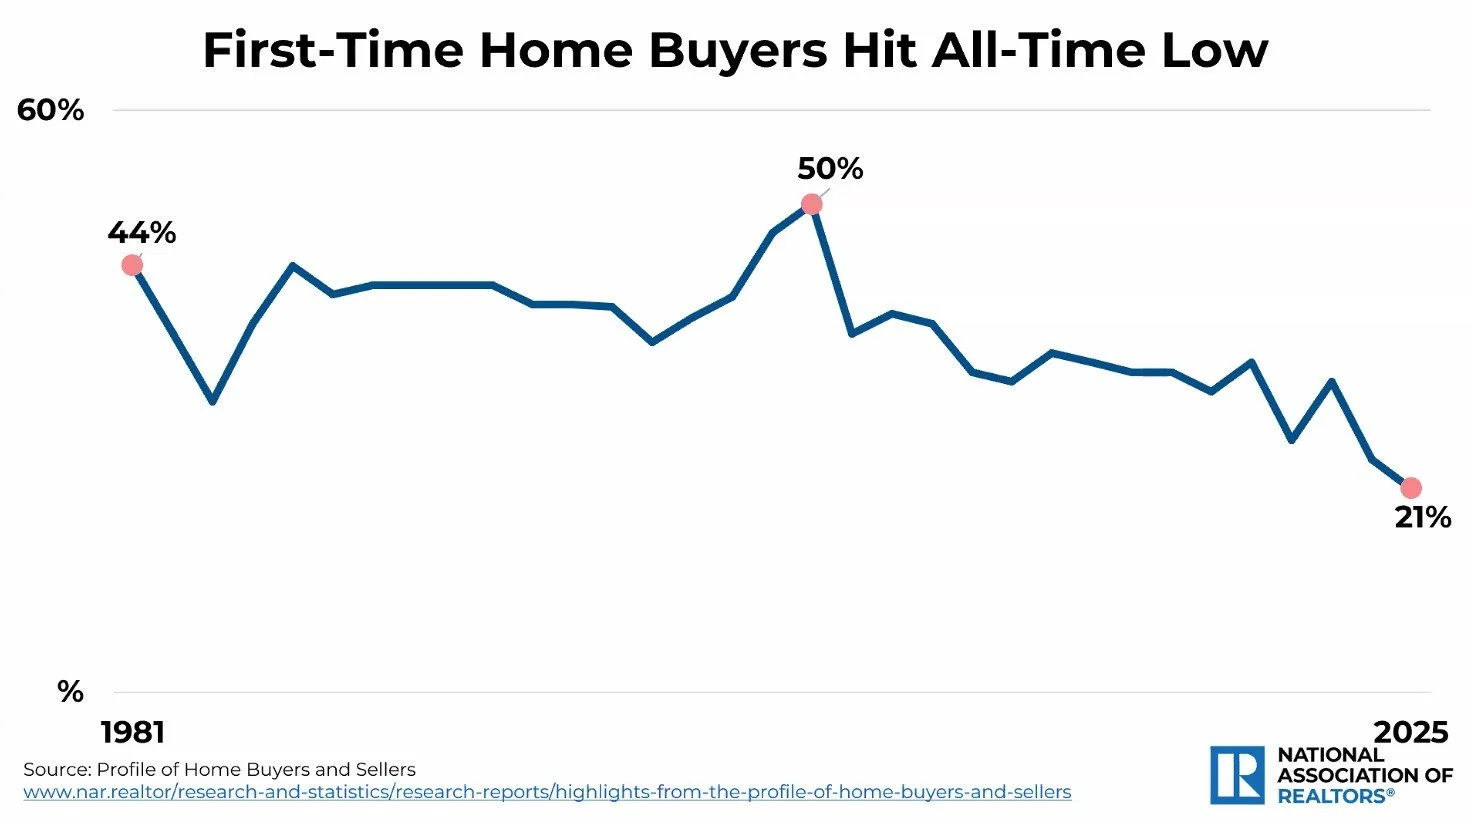
The data is disheartening: first-time buyers have dropped to just 21% of all purchases, the lowest share on record, down from 44% in 1981 and a peak of 50% after the Great Recession.
That’s not a small cyclical wobble; it’s a structural shift. Several forces are working against first-time buyers:
Relentless price appreciation since 2020
Higher mortgage rates compared to the 2020–2021 ultra-low era
Student debt and affordability pressures, especially in high-cost markets
Competition from all-cash and repeat buyers who can move faster and put more money down
The critical point: demand from young households hasn’t vanished. It’s been pushed to the sidelines.
U.S. Population by Age (2024)
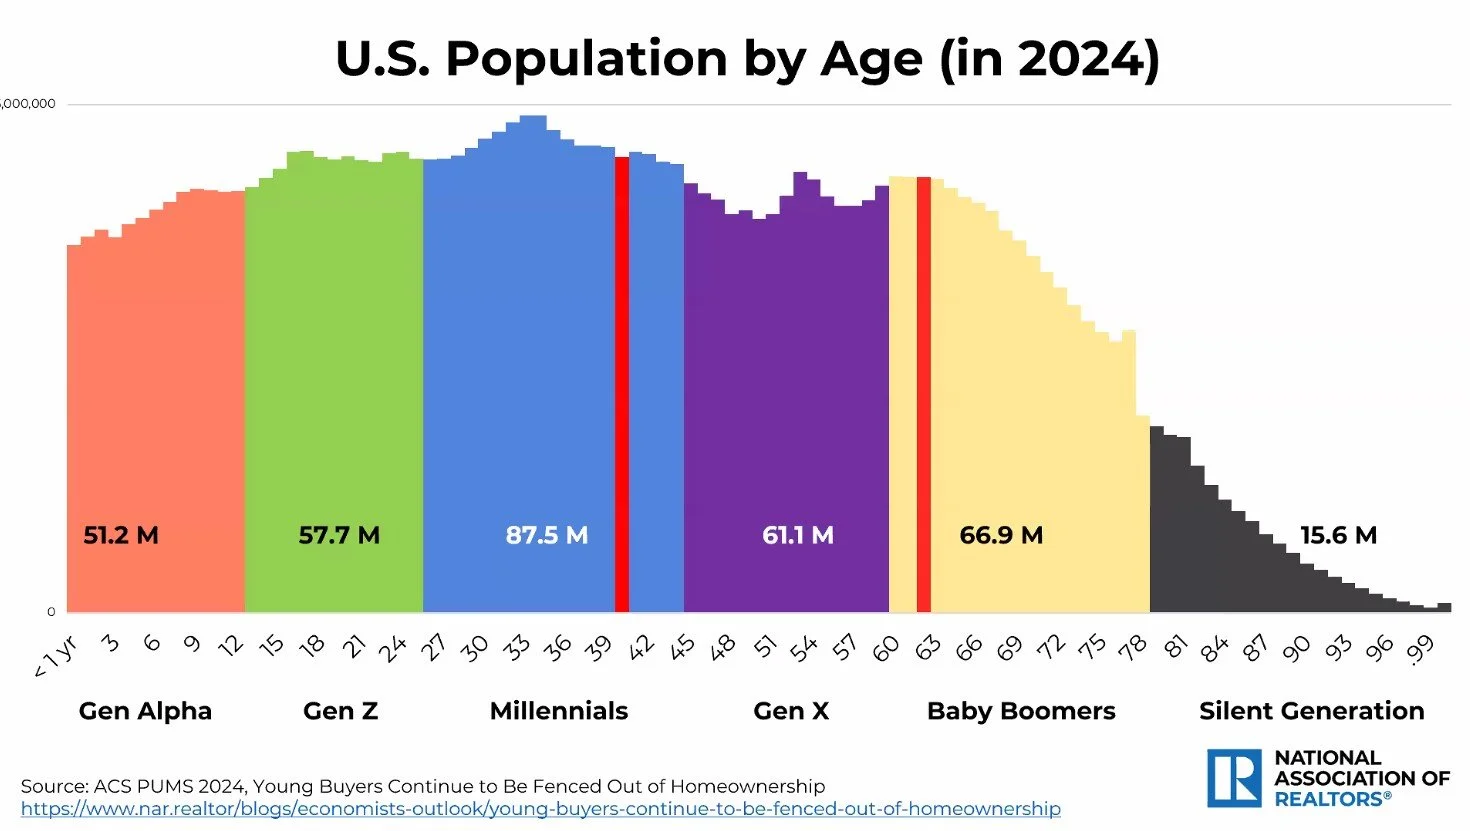
Look at the demographic slide. Millennials—now in their late 20s to early 40s—are the largest generation at 87.5 million, and Gen Z (57.7 million) is right behind them, moving into their prime renting and early buying years. We’ve never had this many potential buyers in the pipeline.
So when you combine record-low first-time-buyer participation with record-high numbers of people in the buying age bands, you don’t get a dead market—you get pent-up demand. That matters a lot for where we’re headed in 2026.
Prices: The Market Slowed, It Didn’t Crash
5-Year Home Price Gains Since Pre-COVID (2020 Q1–2025 Q2)
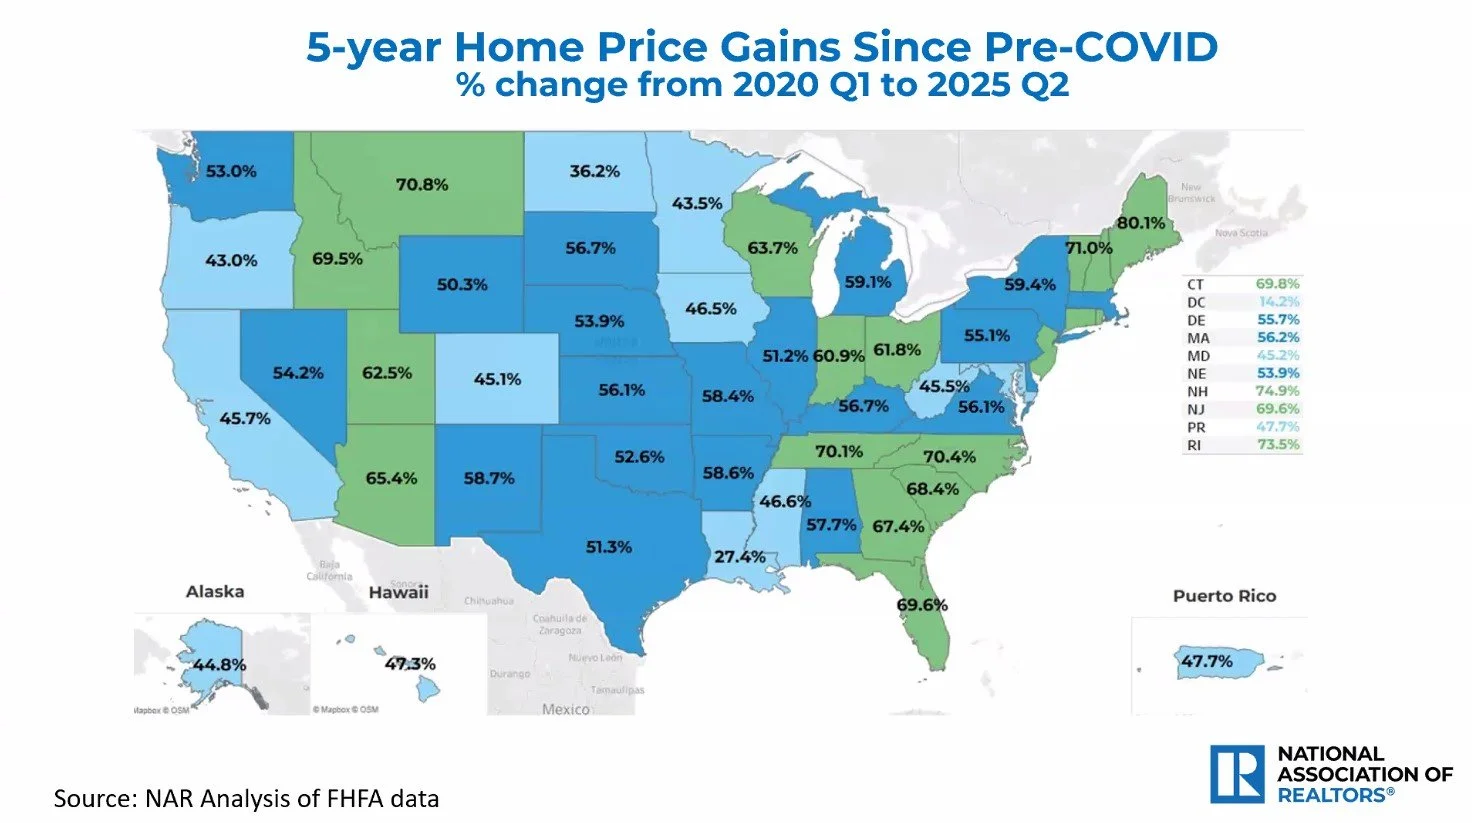
Next, let’s talk prices. The map of 5-year home price gains shows what most homeowners intuitively feel: the last five years have been a massive wealth-transfer event for anyone who owned real estate before COVID.
Many states saw price growth in the 45–70% range.
Some Northeastern and Midwest markets climbed even higher.
Even markets that “cooled” still sit far above their 2019 levels.
This is why affordability feels so punishing. When prices jump 50–70% in half a decade, wages simply don’t keep pace.
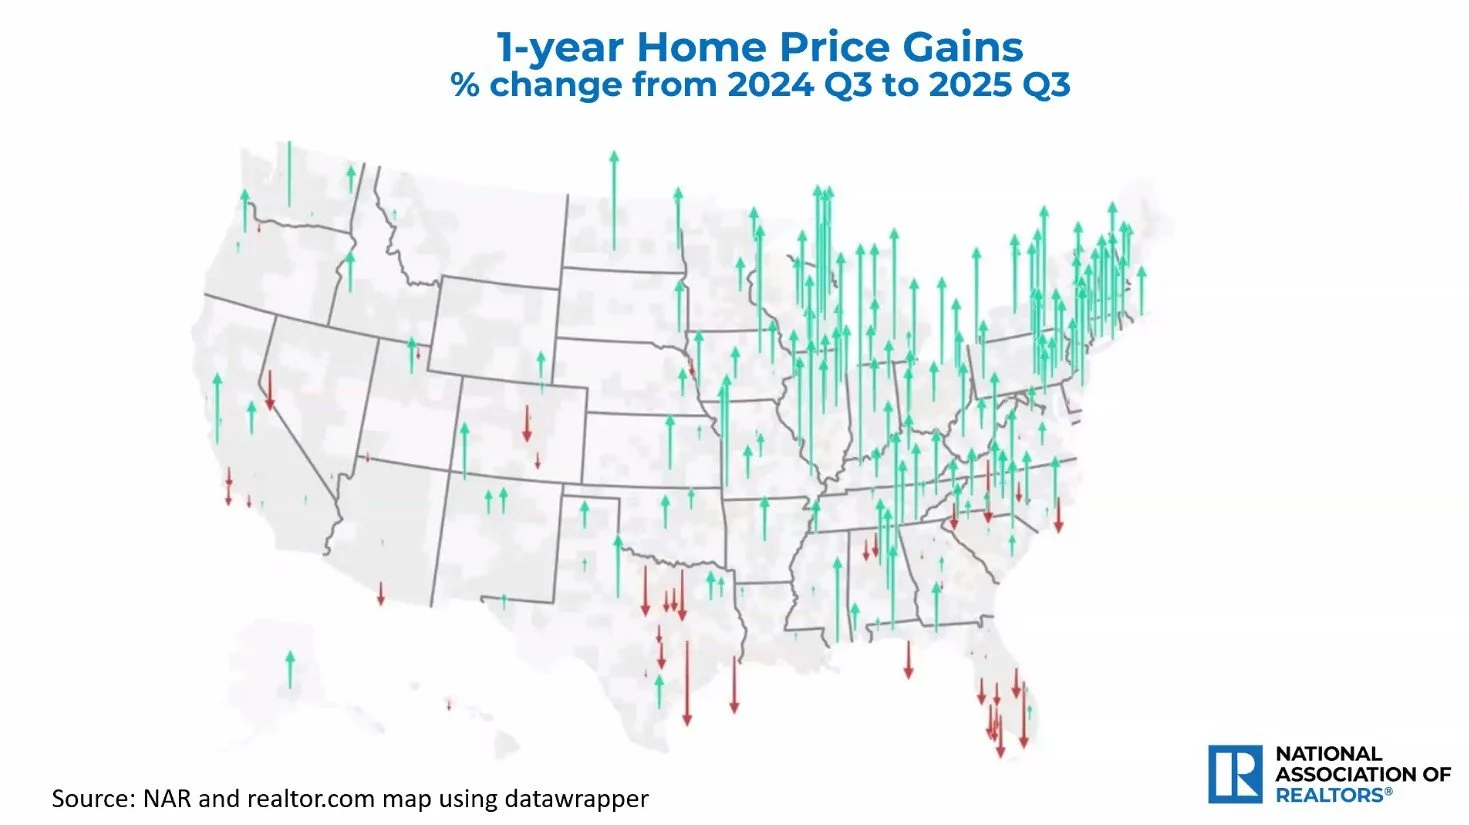
1-Year Home Price Gains (2024 Q3–2025 Q3)
The one-year map tells the second half of the story. Despite higher rates and slower sales, most markets are still posting price gains, not losses. There are pockets of softening—especially in overheated or investor-heavy markets—but nationwide, prices have stabilized at a higher plateau, not reverted to pre-COVID levels.
That’s good news for existing owners. For buyers, it means waiting for a “big crash” has been—and is likely to remain—a losing strategy.
Who’s Actually Buying? Cash, Pros, and Agents

All-Cash Buyers
One of the quieter shifts since 2003 has been the rise of the all-cash buyer, especially among repeat purchasers:
Repeat all-cash buyers are now around 30% of the market.
First-time all-cash buyers—rare in past cycles—are now about 8%.
In plain English: a big slice of this market is being driven by people who are equity-rich, whether they’re downsizing, relocating from higher-priced states, or investors moving capital into housing. That’s one reason why prices haven’t cracked even when financing costs climbed.
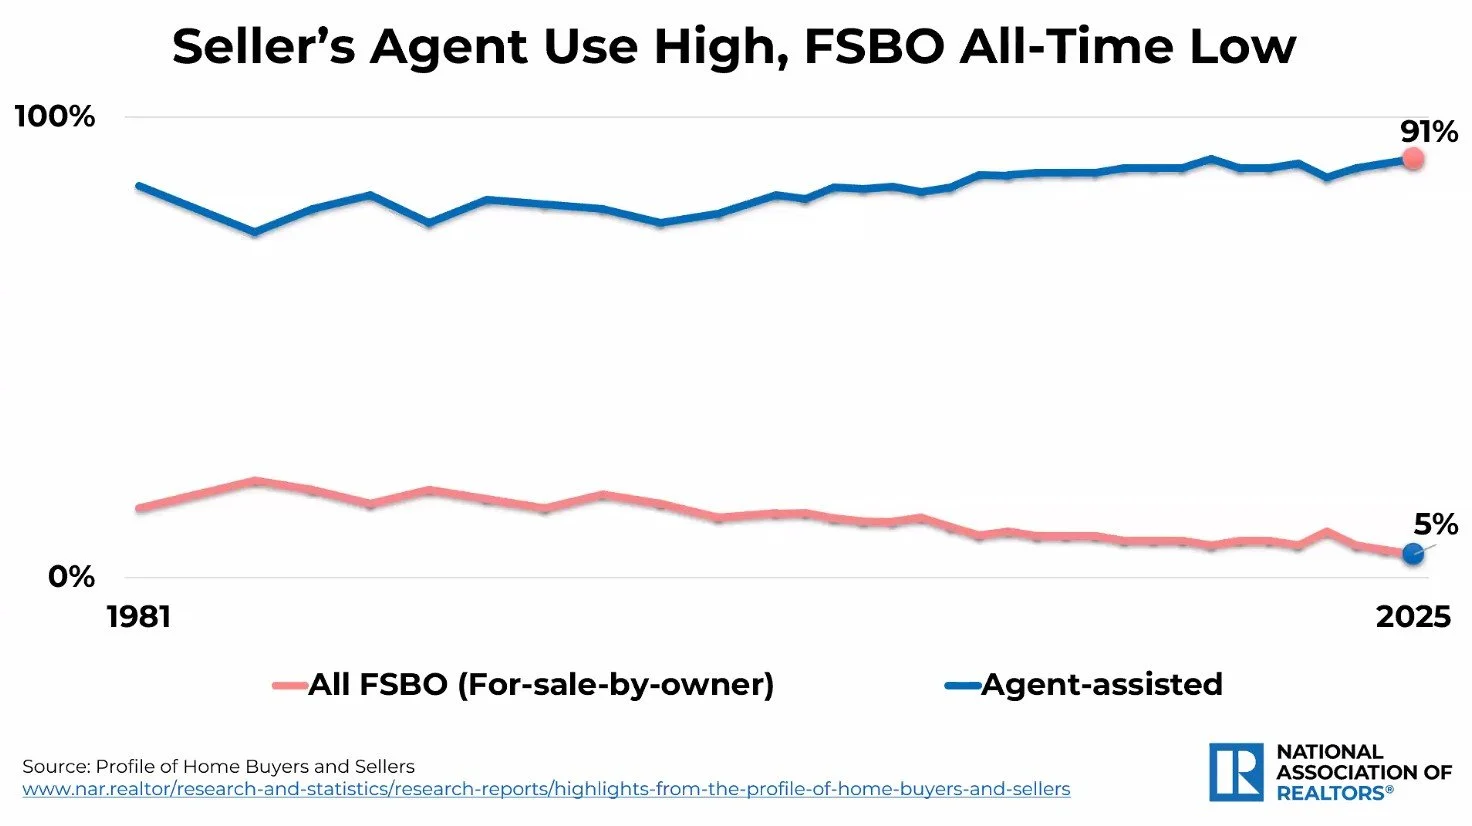
Seller’s Agent Use High, FSBO All-Time Low
At the same time, 91% of sellers now use an agent, while for-sale-by-owner (FSBO) has fallen to about 5%—an all-time low. In a world of complex contracts, appraisal gaps, multiple-offer strategies, and non-contingent cash bids, consumers are voting with their feet. They want professional representation on both sides of the table.
For buyers and sellers, this means the market is increasingly professionalized and competitive. The days of casual, DIY real estate are largely over. Further, Texas real estate laws are highly slanted towards buyers: buyers have up to four years to sue sellers for damages.
Jobs and the Real Economy: The Floor Under Housing
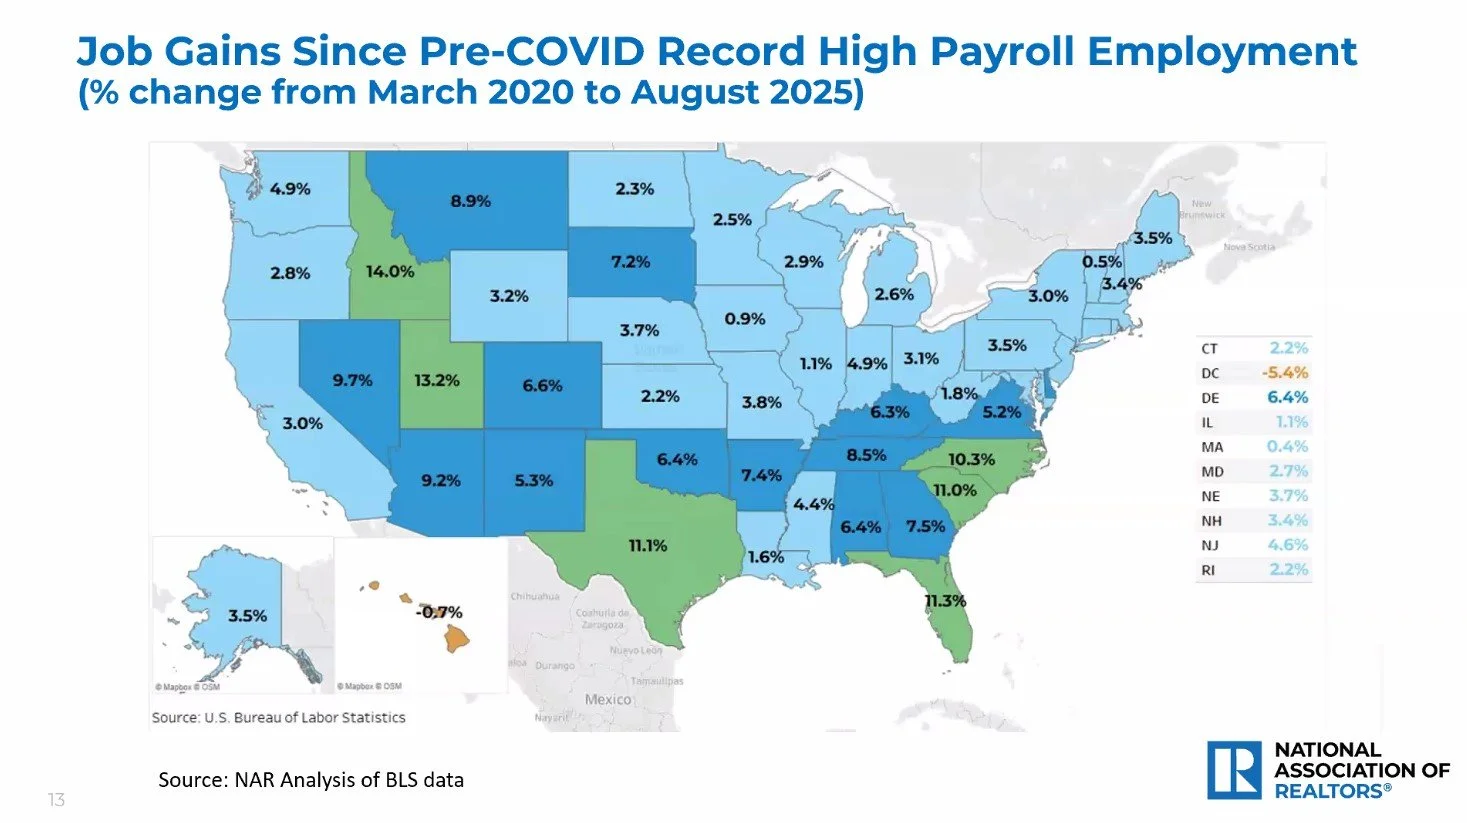
Job Gains Since Pre-COVID Record High Payroll Employment
Housing doesn’t exist in a vacuum. The job-growth map from March 2020 to August 2025 explains why the market has bent but not broken.
Most states show positive job gains since pre-COVID.
Many Sun Belt markets—including Texas—have posted double-digit payroll growth.
Even slower-growth states have largely avoided deep employment losses.
Steady job creation and rising wages provide a floor under housing demand. People may move to more affordable markets, rent longer, or adjust location and size—but as long as they’re employed, they still need somewhere to live. That’s why price collapses are rare outside of severe, jobs-driven recessions.
NAR’s 2025–2026 Forecast: What Changes, What Doesn’t

Nationwide Forecast
Now we get to the heart of the presentation: NAR’s nationwide forecast.
For 2025, NAR expects:
Existing-home sales: essentially flat (0% growth)
New-home sales: slightly negative (-2%)
Median home price: +3%
Mortgage rate: around 6.7%
Job gains: about 400,000
Unemployment: 4.3%
In other words, 2025 is likely to look a lot like 2024—tight, frustrating, and still expensive, but relatively stable.
For 2026, NAR is calling for a meaningful shift:
Existing-home sales: +14%
New-home sales: +5%
Median home price: another +4%
Mortgage rate: easing to about 6.0%
Job gains: ramping up to 1.3 million
Unemployment: nudging slightly higher to 4.5% (still historically low)
The message is clear: NAR sees volume coming back before prices come down. Lower mortgage rates unlock more sellers who have been clinging to 3–4% loans, more buyers who finally qualify, and more overall churn in the system. But the combination of:
Years of under-building
Strong demographics
And broadly healthy employment
…means that increased activity is expected to come with continued price growth, not broad-based discounts.
For frustrated first-time buyers, that prediction is sobering. For current owners, it suggests continued equity growth—just at more normal, mid-single-digit levels rather than the breakneck pace of 2020–2021.
Where NAR Thinks the Action Will Be in 2026
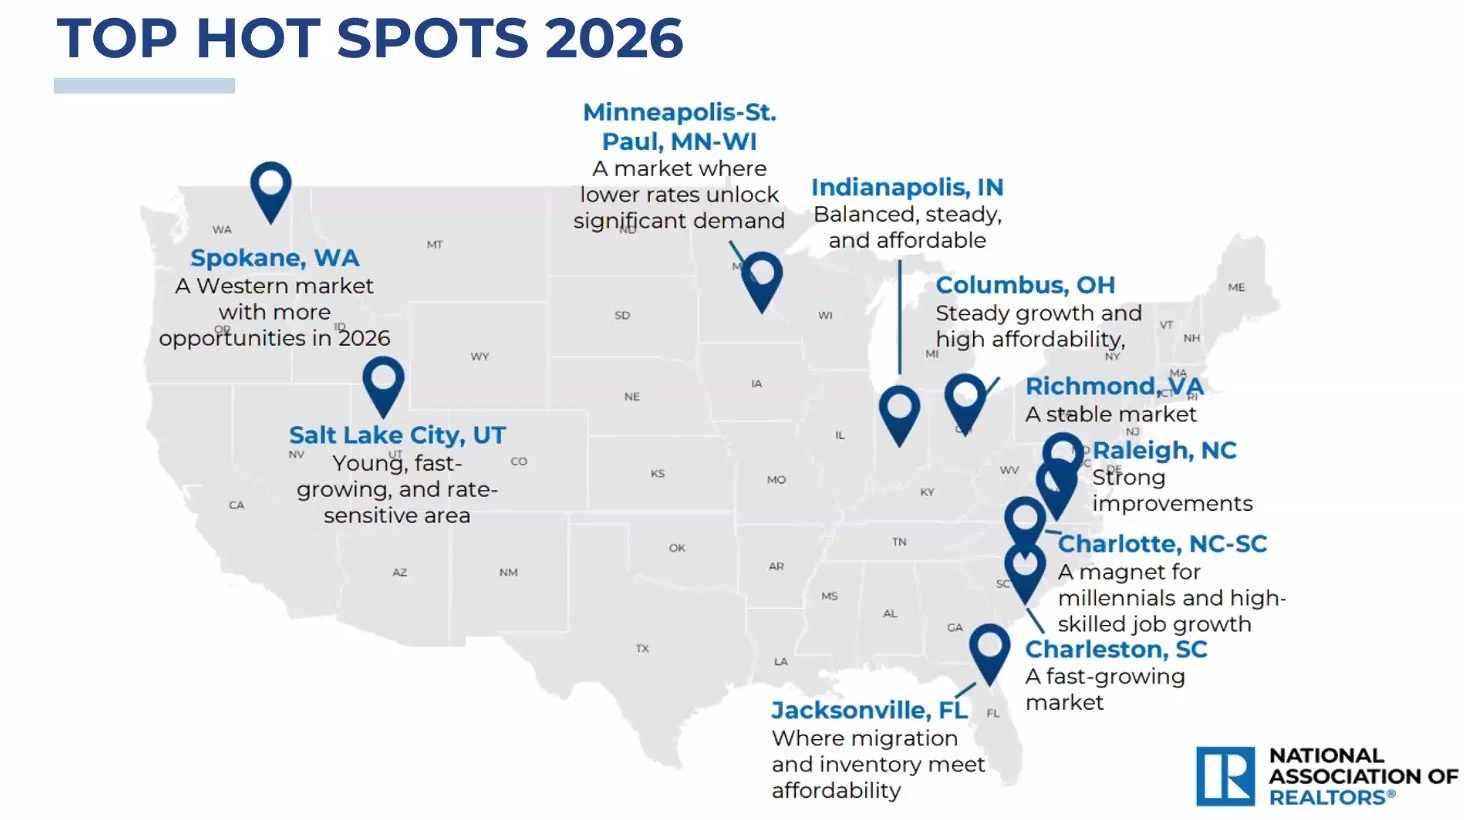
Top Hot Spots 2026
NAR also highlights a set of “Top Hot Spots” for 2026, including:
Spokane, WA
Salt Lake City, UT
Minneapolis–St. Paul, MN–WI
Indianapolis, IN
Columbus, OH
Richmond, VA
Raleigh, NC
Charlotte, NC–SC
Charleston, SC
Jacksonville, FL
Notice what’s not on that list: Texas. That doesn’t mean Texas is in trouble. It means NAR expects these particular metros to see outsized growth relative to their own history, driven by affordability, job pipelines, and demographic inflows.
Texas markets like San Antonio and the Hill Country have already been “discovered.” We’ve been hot for several years now, and the data from the price-growth and job-gains maps reflect that. Going forward, I expect Texas to transition from “breakout story” to steady workhorse—still growing, still attracting people and businesses, but not necessarily the newest shiny object on the national forecast slide.
For buyers relocating from high-cost states, that’s not bad news at all. It means:
We’re less likely to see wild, speculative spikes.
We’re more likely to see sustainable growth anchored by real jobs and in-migration, not hype.
How This All Fits Together
If you stack these slides in order, a coherent picture emerges:
Demographics guarantee a large pool of would-be buyers (Millennials and Gen Z).
Affordability constraints and rapid price gains have pushed first-time buyers to record lows.
All-cash and equity-rich buyers have helped keep prices elevated.
Job growth has stayed positive, supporting housing demand.
Sales volumes have been stuck at about 75% of pre-COVID levels, not because people don’t want to move, but because they’re locked in by rates and prices.
NAR’s 2026 forecast assumes some rate relief, stronger job creation, and a release of this pent-up demand—driving transaction growth and moderate price appreciation.
The working conclusion is simple:
2025 is likely to be another “grind it out” year.
2026 has the potential to feel like the market finally “unfreezes,” especially if mortgage rates drift closer to 6% and job growth stays intact.
What This Means If You’re Planning a Move
Whether you’re a first-time buyer, a move-up seller, or someone relocating from California or another high-cost state into Texas, here’s the practical read-through:
Waiting for a crash is still a bad strategy. NAR sees more sales and higher prices in 2026, not lower.
Your real decision is timing vs. lifestyle. If a move improves your quality of life, shortens your commute, or gets you out of a financially unsustainable situation, the data argues for acting based on your life—not on wishful thinking about price resets.
Equity is your biggest advantage. If you own in a high-appreciation market (Silicon Valley, coastal California, parts of the Northeast), the last five years have handed you a rare opportunity: convert that equity into a more affordable home and a lower-stress lifestyle in places like Texas Hill Country.
Professional guidance matters more than ever. With 91% of sellers using agents and a growing share of cash and contingent-complex deals, going it alone is increasingly risky. The numbers—and the liability—have both gone up.
I work with a lot of people who are trying to thread this needle: maximize what the last five years have given them, without betting their future on a market that is not going back to 2015 prices. If you’re in that camp and want a data-driven, no-nonsense look at your options, that’s exactly the conversation I’m having every day.